
Training Materials > Module 2
Reading the SIGWX chart
The significant weather chart, or SIGWX, shows the weather that matters to aircraft between FL100 and FL600: cumulonimbus, jet streams, fronts and tropical cyclones, and the weather at the larger airports. It comes from the meteorological provider by fax, so it’s in black and white, with a speck or two from the telephone line. It follows the conventions of ICAO Annex 3 and the WMO.
This module goes through the chart from the top down, symbol by symbol. Have a chart in front of you as you read.
The top of the chart
The line across the very top is printed by the sending machine: the day and time it was sent, the provider’s fax number and name, and the page.
The title block at the top left says what the chart is:
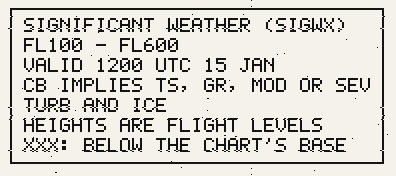
FL100 - FL600: the levels it covers. Anything below FL100 isn’t on it; for that, read the airports’ reports and forecasts.VALID 1200 UTC 15 JAN: the time the chart is for. It shows the weather as it will be then, not over a period.CB IMPLIES TS, GR, MOD OR SEV TURB AND ICE: wherever cumulonimbus is marked, expect thunderstorms, hail, and moderate or severe turbulence and icing, though none of them is drawn.HEIGHTS ARE FLIGHT LEVELS:340means FL340.XXX: BELOW THE CHART’S BASE: a height ofXXXis below FL100.
The dotted lines are every ten degrees of latitude and longitude, numbered at the edges. The thin solid lines are the coasts.
Cumulonimbus
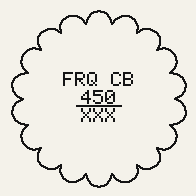 | 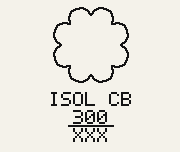 |
A scalloped line encloses each area of cumulonimbus. Its label is inside it, or under it when the area is too small to hold it. The label reads from the top:
- How much there is, then
CB. - The tops, as a flight level:
450is FL450. - A line, and under it the base:
XXX, below FL100. Cumulonimbus reaches down to near the ground, so its base is always below the chart.
How much is said as ICAO has it, by how much of the area the cumulonimbus covers:
ISOL | Isolated: separate cells, covering less than half the area |
OCNL | Occasional: well separated, covering half to three-quarters |
FRQ | Frequent: little or no gap between them, covering more than three-quarters |
EMBD | Embedded in layers of other cloud, so it can’t be seen from the cockpit
and has to be found on radar. It goes with one of the others, as FRQ EMBD CB. |
So FRQ CB over 450 over XXX is frequent cumulonimbus with tops at
FL450 and its base below FL100. Remember the title block: every one of them means thunderstorms,
hail, turbulence and icing.
Tropical cyclones
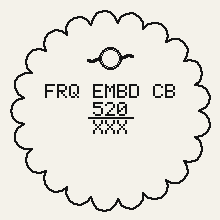
A tropical cyclone (a hurricane or typhoon) is the ring with a curved arm either side, at
its centre. Around it, the cumulonimbus of its rain bands is marked as any other, as frequent and
embedded: FRQ EMBD CB, with tops well above FL500. Where it’s heading, and the airports in
its way, are in the provider’s advisory, which comes by fax: see Faxes and
briefs.
Jet streams
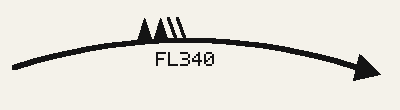
A heavy line with an arrowhead is the core of a jet stream, wherever the wind is 80 knots or more. The arrowhead is at the end the wind is blowing towards.
Where the jet is fastest, and every so often along a long one, its speed is marked on the line in pennants and feathers, as on a wind barb, with the flight level of the core on the other side of the line:
| A pennant (a filled triangle) | 50 knots |
| A feather (a stroke) | 10 knots |
Add them up. Above, two pennants and two feathers are 120 knots, at FL340. Below, one pennant and four feathers are 90 knots, at FL300.
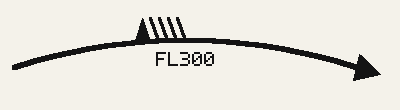
As on a wind barb, the pennants are furthest upwind, with the feathers downwind of them, and both lean back into the wind. They stand on the side of the line towards the pole, which is the side of lower pressure: above the line north of the equator, with the flight level beneath, and below it south of the equator, with the flight level above.
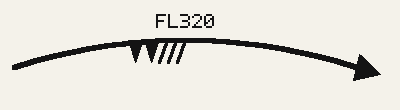
Speeds are to the nearest 10 knots. The wind shear at a jet’s edges is where clear-air turbulence is likeliest.
Fronts
Fronts have the same symbols as on the surface chart, in black. The symbols are on the side the front is moving towards; in these, it’s moving up the page.
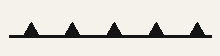 | Cold front: triangles. |
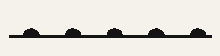 | Warm front: half-discs. |
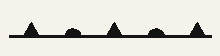 | Occlusion: triangles and half-discs in turn, on the same side. |
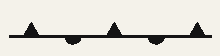 | Quasi-stationary front: triangles on one side and half-discs on the other. It’s hardly moving. |
Weather at airports
At the larger airports with weather to report, the chart has the WMO symbol for it. The small ring marks the airport, with the symbol above it. Where an airport reports more than one kind of weather, a thunderstorm is shown first, then anything falling, then the rest. Where airports are close together, only one has its symbol, so that they don’t run into each other. For the full picture at an airport, read its METAR and TAF.
The more dots, commas or stars, the heavier it is: two side by side for light, three in a triangle for moderate, four in a diamond for heavy. These are the WMO’s symbols for continuous rain, drizzle and snow. A single mark, or marks one above the other, would mean it was coming and going, which a report doesn’t say, so the chart never has them.
   | Rain: light, moderate, heavy-RA RA +RA |
   | Drizzle: light, moderate, heavy-DZ DZ +DZ |
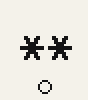 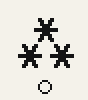  | Snow: light, moderate, heavy. Snow grains have the star too.-SN SN +SN SG |
 | Ice pellets: an open triangle with a dot in it, however hard they’re fallingPL |
 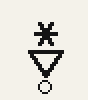  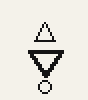 | Showers: an open triangle, point down, under what’s falling: a dot for rain, a star for snow, a
filled triangle for hail, an open one for small hailSHRA SHSN SHGR SHGS |
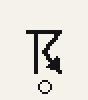 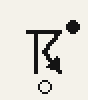 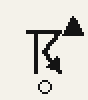 | Thunderstorm: alone, with rain, with hail. What’s falling is at the top right.TS TSRA TSGR |
  | Freezing rain, freezing drizzle: a wave, for ice forming on whatever it lands on, over what’s fallingFZRA FZDZ |
 | Fog: three bars. Freezing fog has them too.FG FZFG |
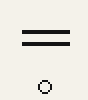 | Mist: two barsBR |
 | Haze: two rings side by sideHZ |