Airline scheduling, dispatch and fleet management. The best system for airline operations.
$24.99 / £19.99 / €23.99
Flight Dispatch 98 at a glance
Every screen sits beside the Terminal. Alerts at the top show the operation’s open issues as they happen, such as late pushbacks with their IATA delay codes, aircraft due at the wrong airport for their next flight, and crew late from another flight. Messages below show the teletype traffic between the airline and the airports. The status bar gives the last 24 hours’ on-time performance.
Schedule
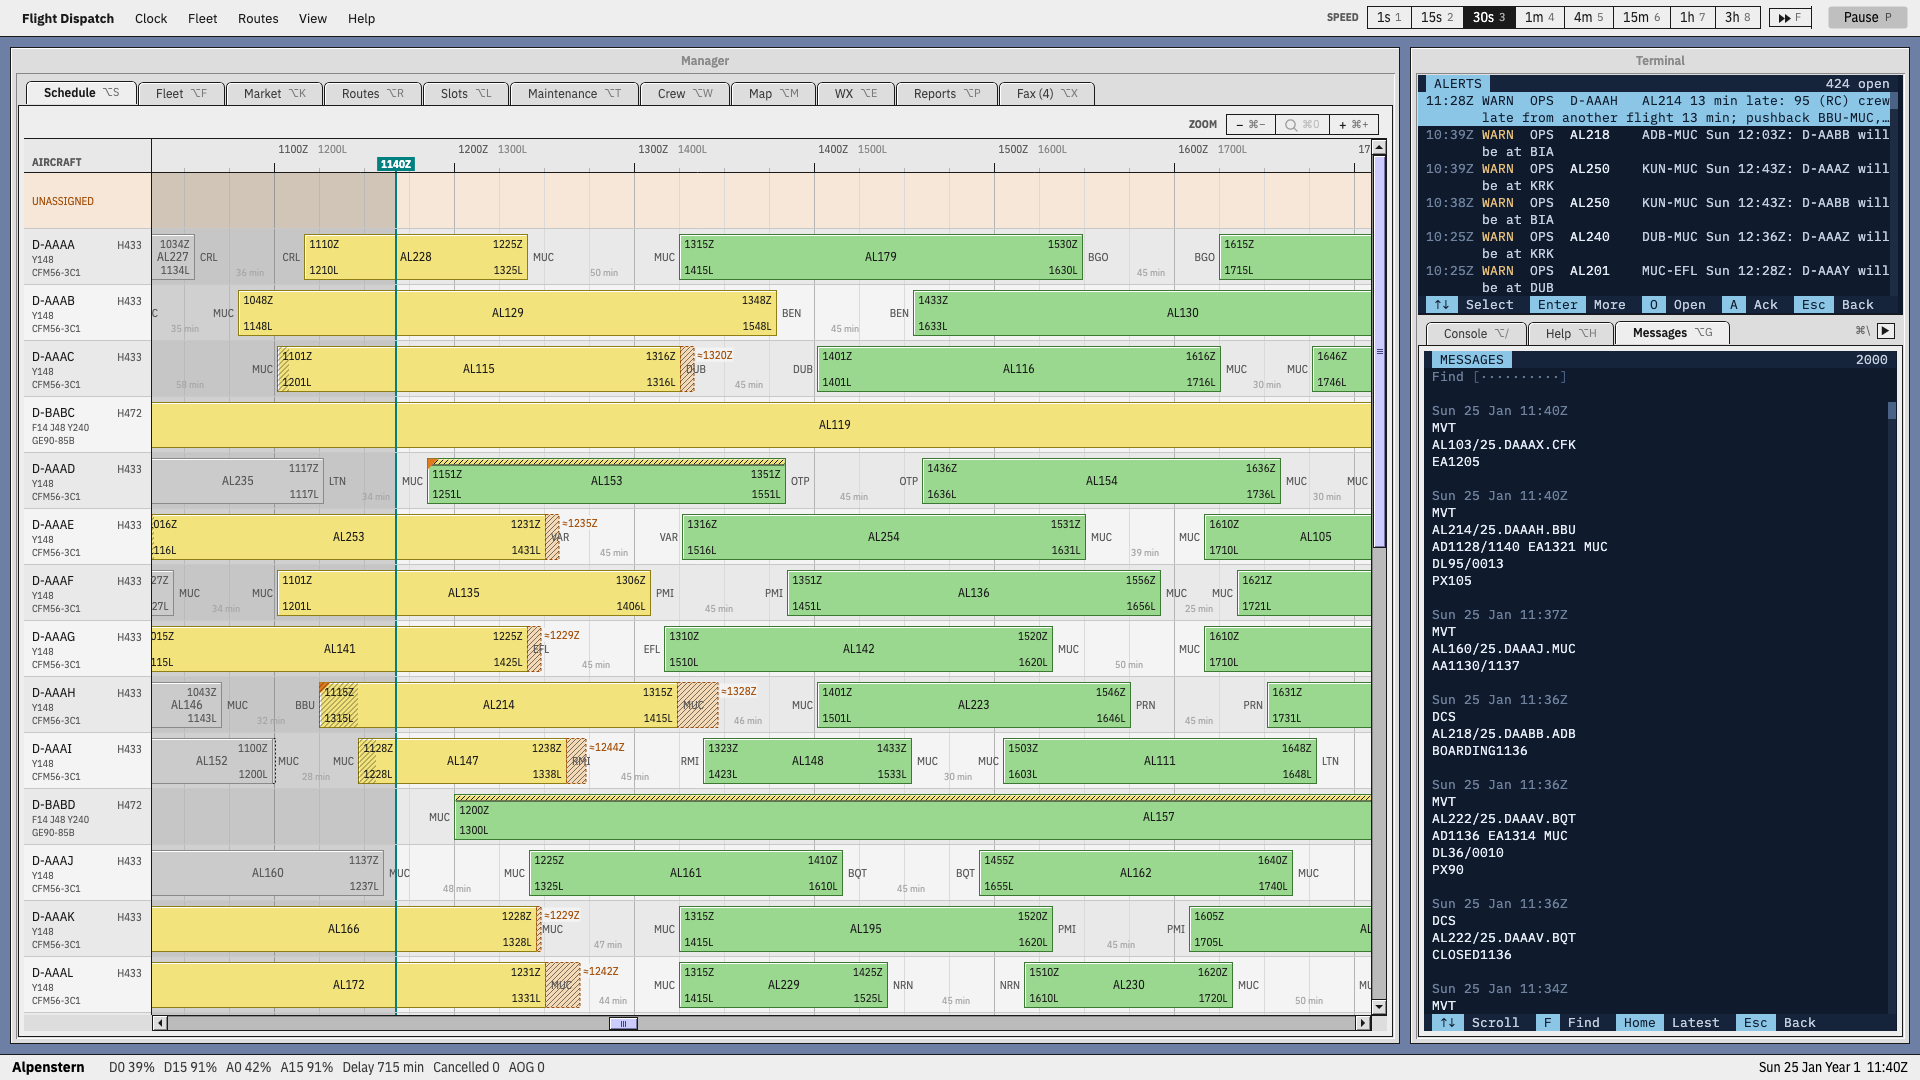
A Gantt chart of the fleet against time: each aircraft’s flights as bars, in UTC and local time, with the turnaround between them. Delays show as hatched extensions, and flights not yet given an aircraft wait in the Unassigned row at the top.
Fleet
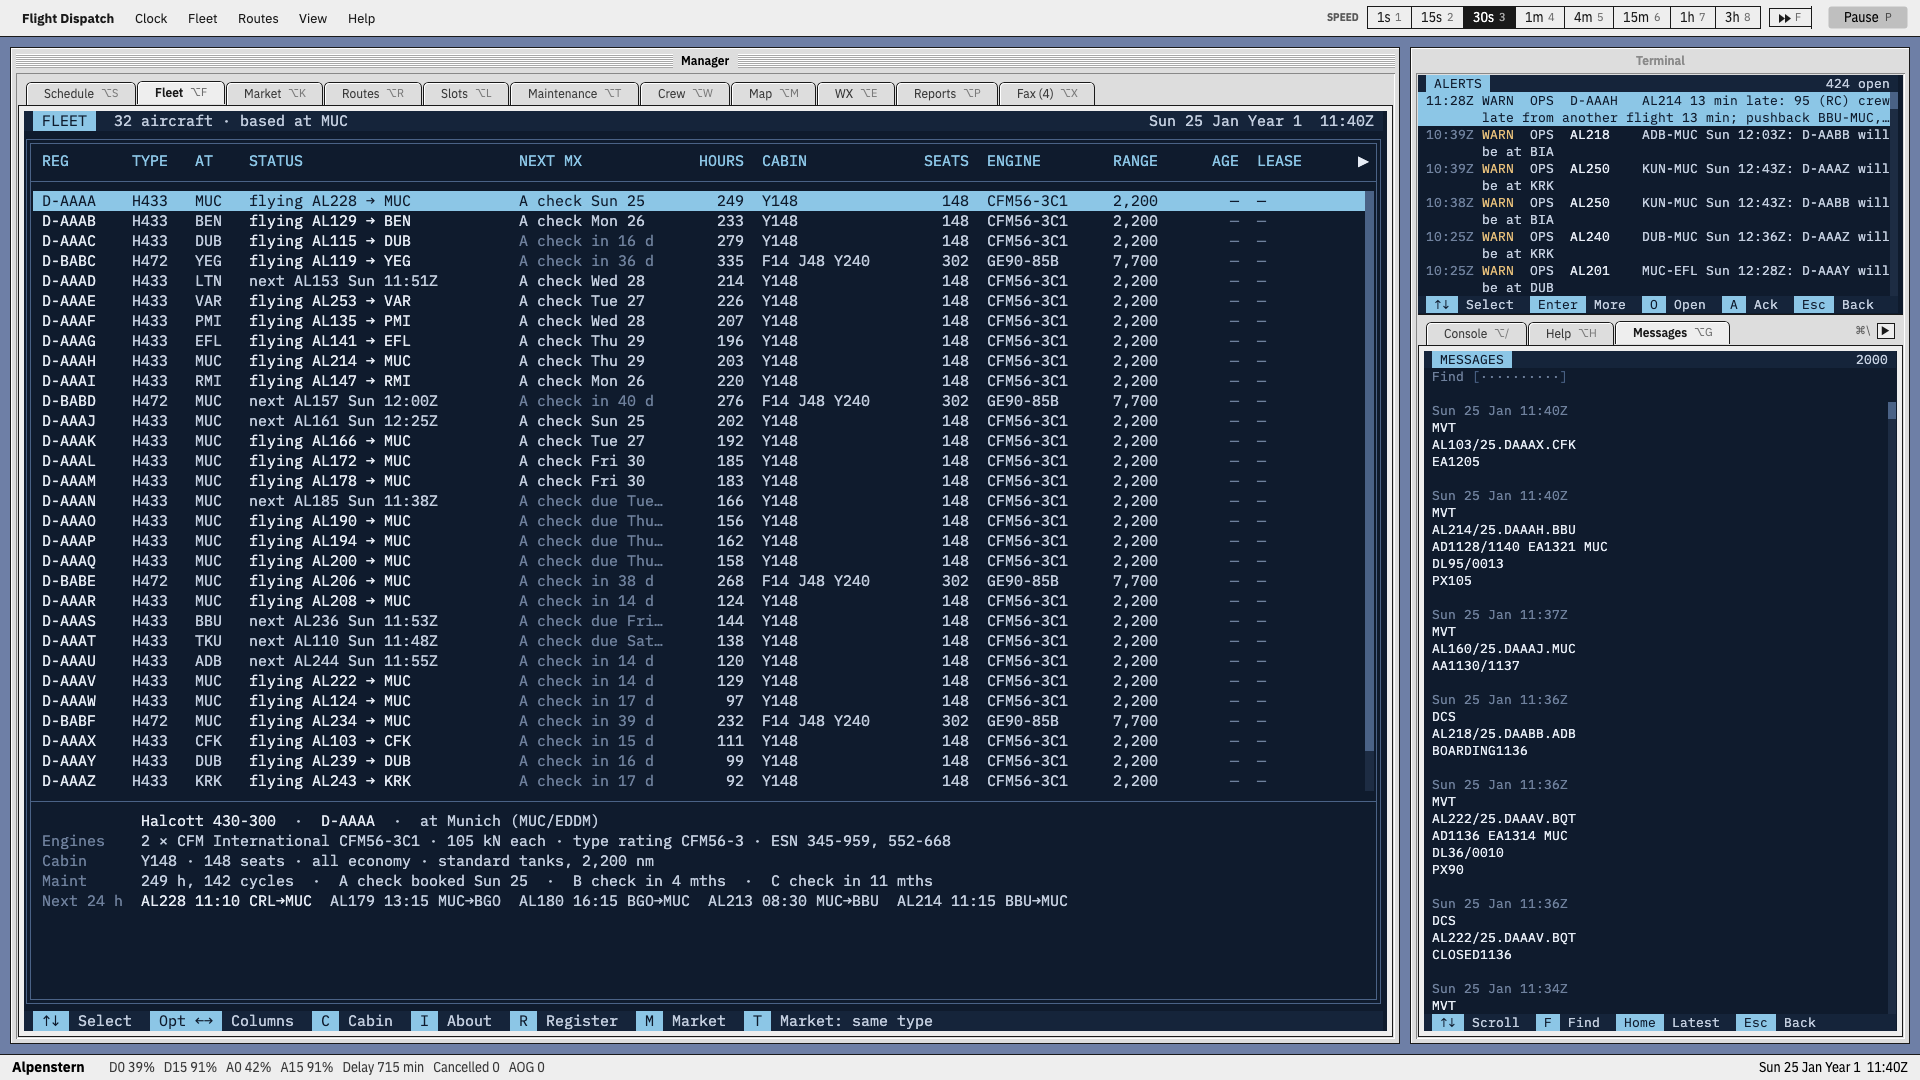
Every aircraft in the fleet: where it is, what it’s doing now or next, the next maintenance due, hours flown, cabin, seats, engines and range. The aircraft selected below shows its engines’ serial numbers, check schedule and the next 24 hours of flying.
Market
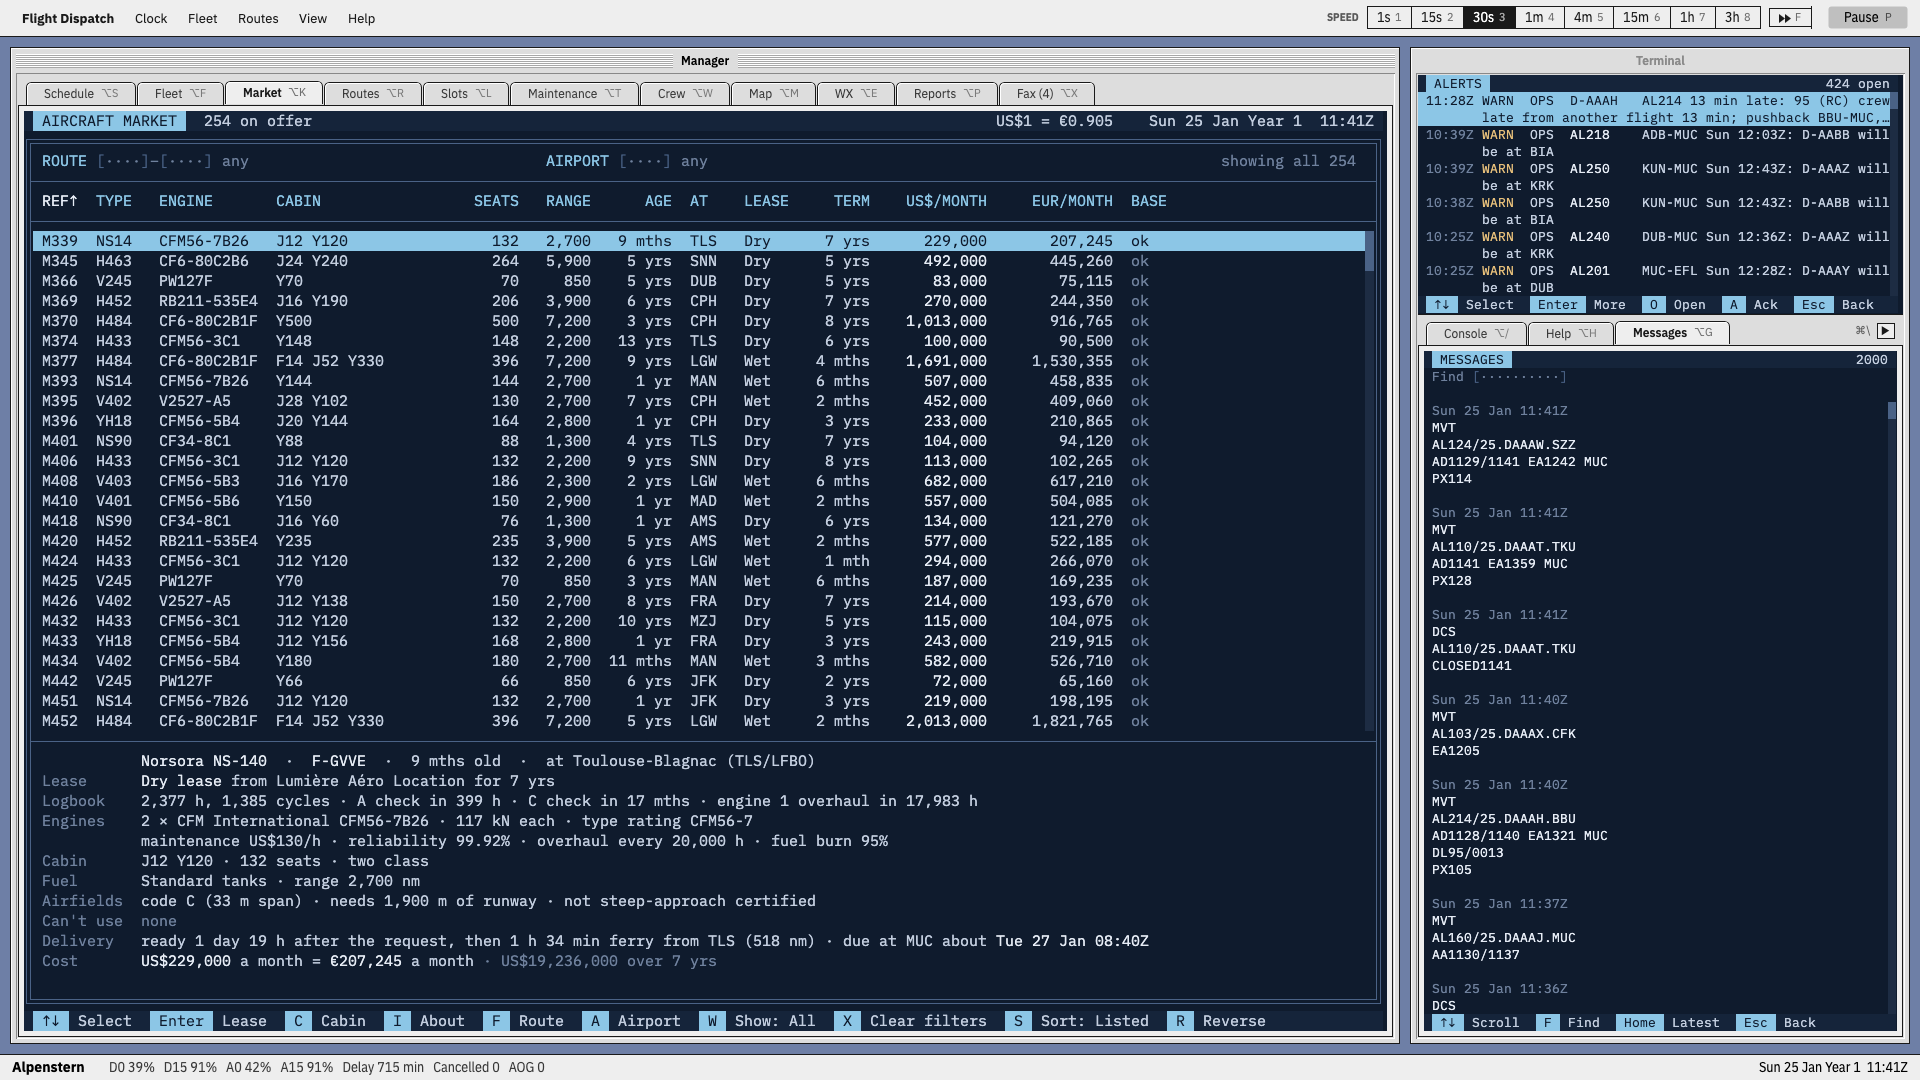
Aircraft offered for lease by lessors: type, engines, cabin, age, location, wet or dry lease, term and monthly cost in both currencies. The selected aircraft shows its logbook, the airfields it can’t use, when it could be delivered, and the total cost of the lease.
Routes
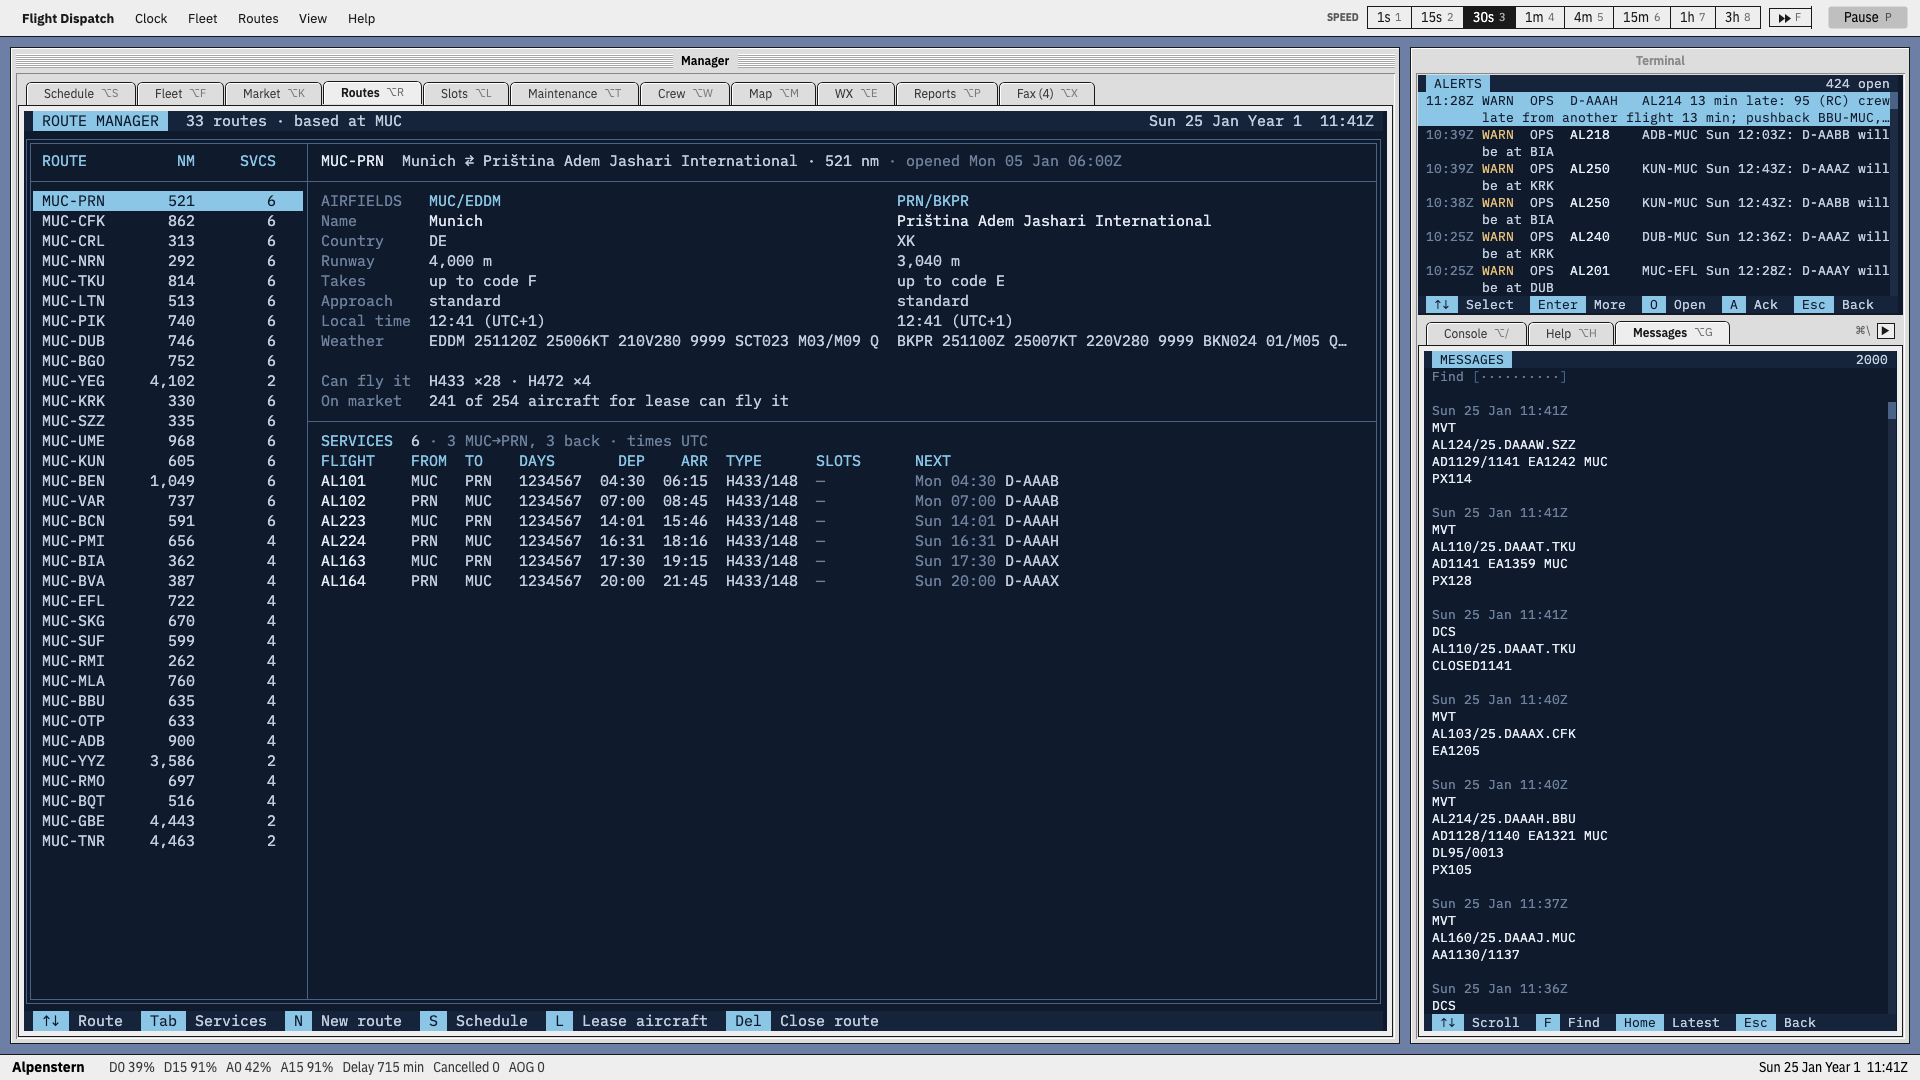
The airline’s routes, with each one’s distance and services. The selected route compares the two airports (runway, approach, local time, live weather) and lists its scheduled services with their days, times, aircraft type and next aircraft.
Slots
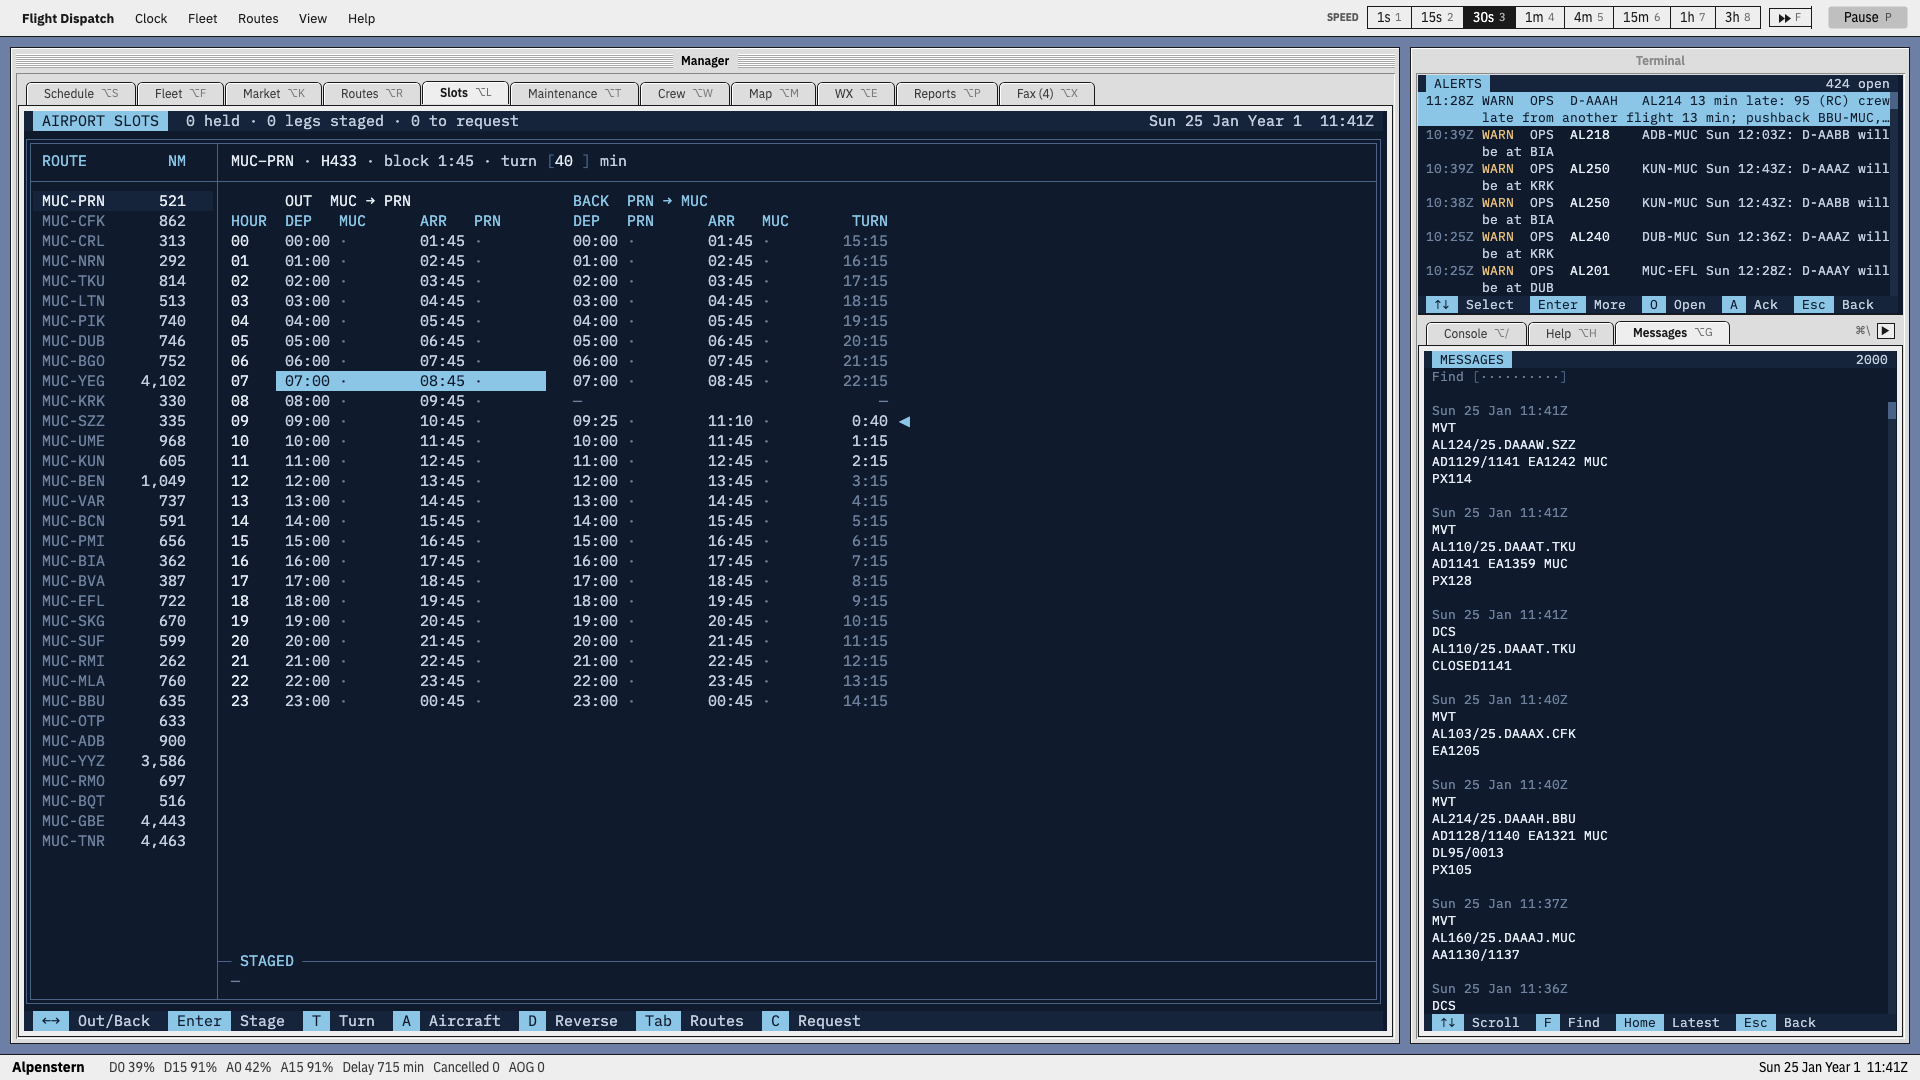
Plans a route’s flights hour by hour: block time, turn time, departure and arrival on each leg, and the aircraft’s time back. Legs are staged, then requested as slots from coordinated airports.
Maintenance
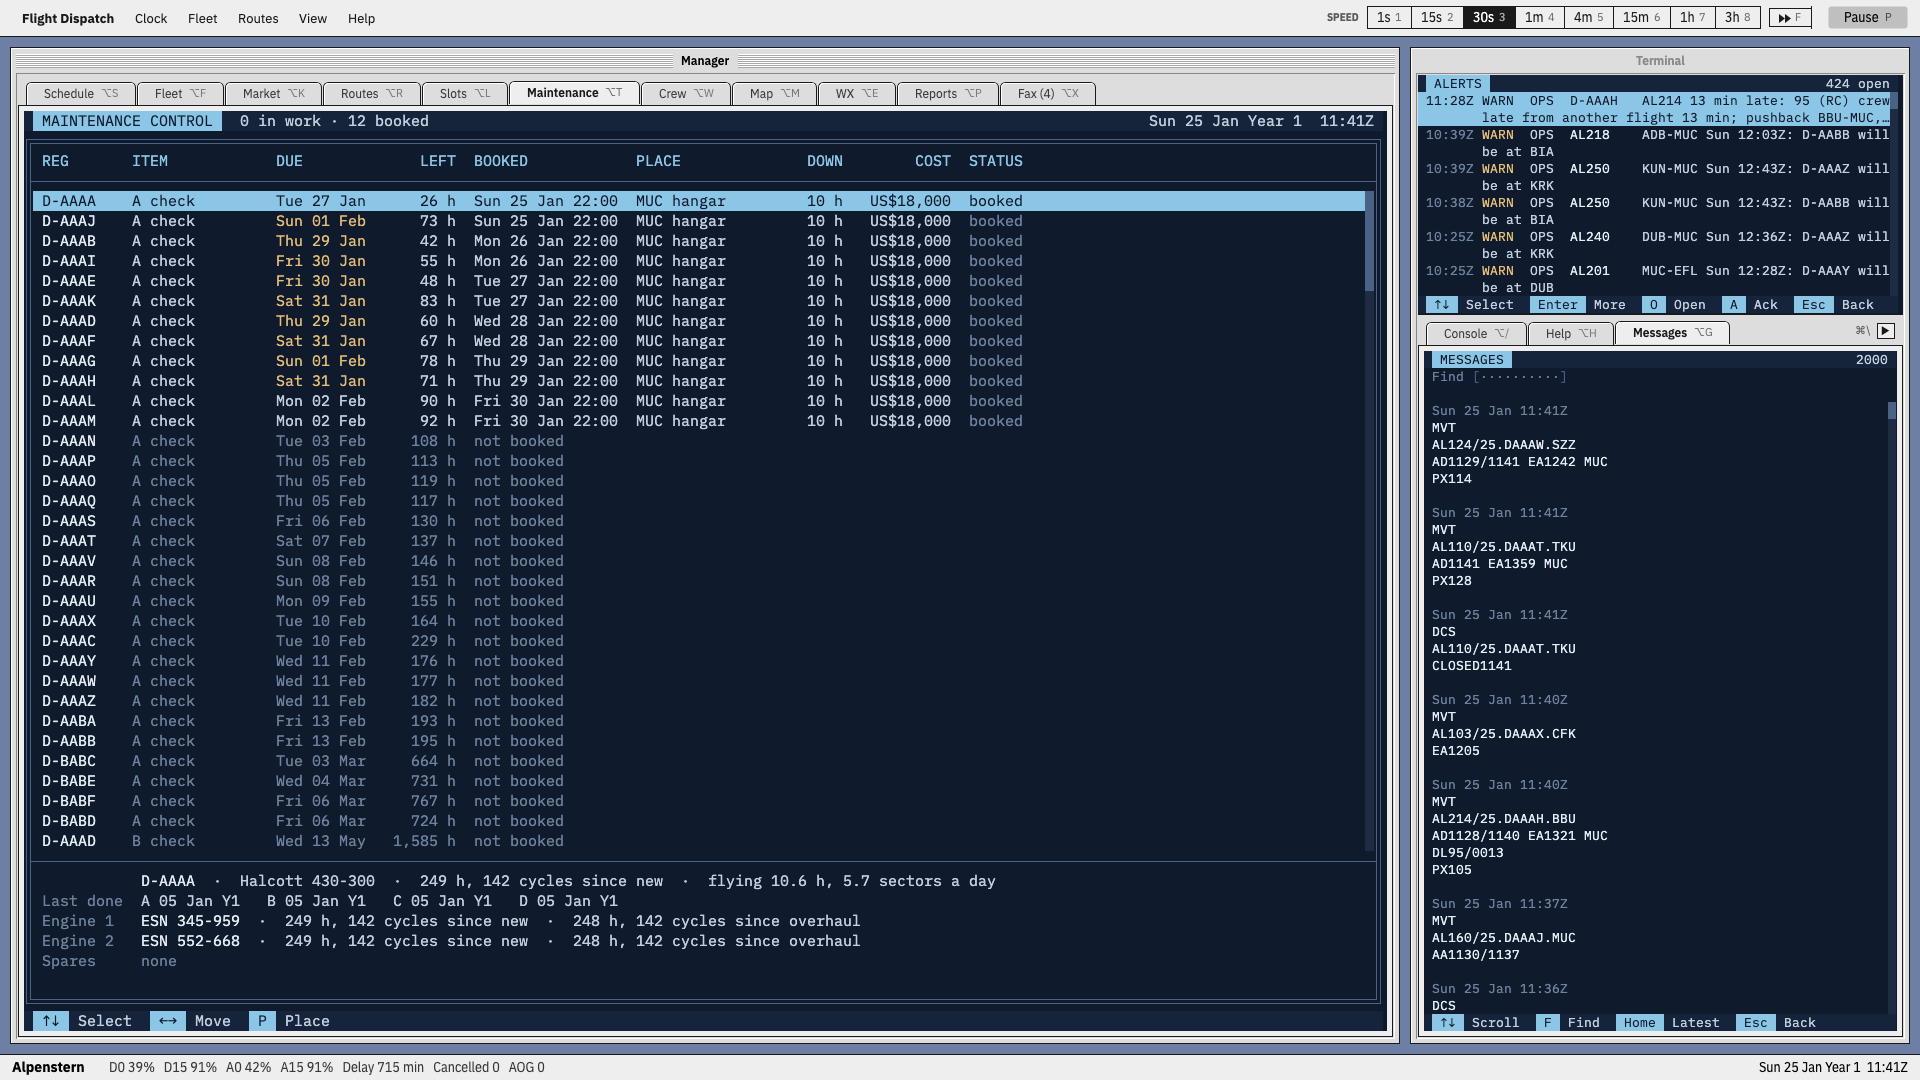
The checks each aircraft has coming up: when they’re due, the hours left, which are booked, where, for how long and at what cost. The selected aircraft shows its checks last done and each engine’s hours and cycles since new and since overhaul.
Crew
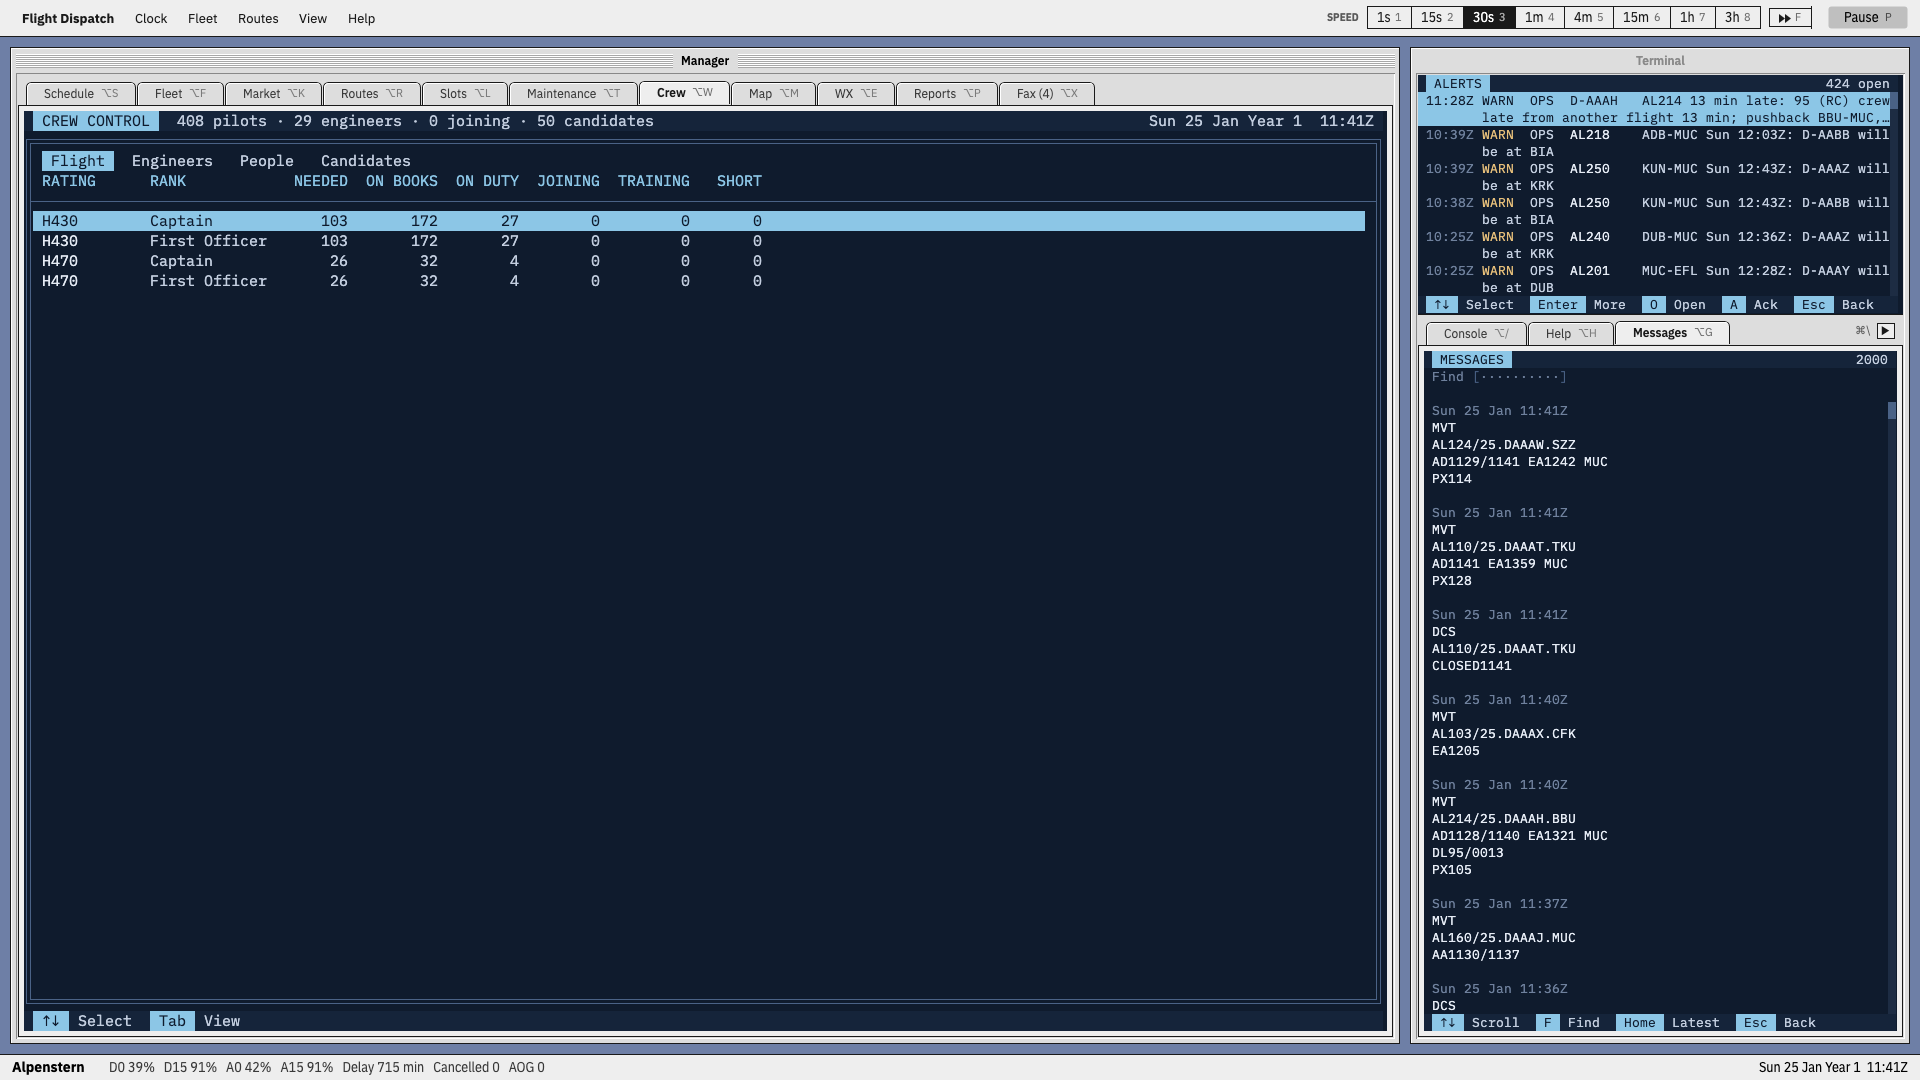
Pilots by type rating and rank: how many are needed, on the books, on duty, joining and in training, and any shortfall. Other views list engineers, people and candidates to hire.
Map
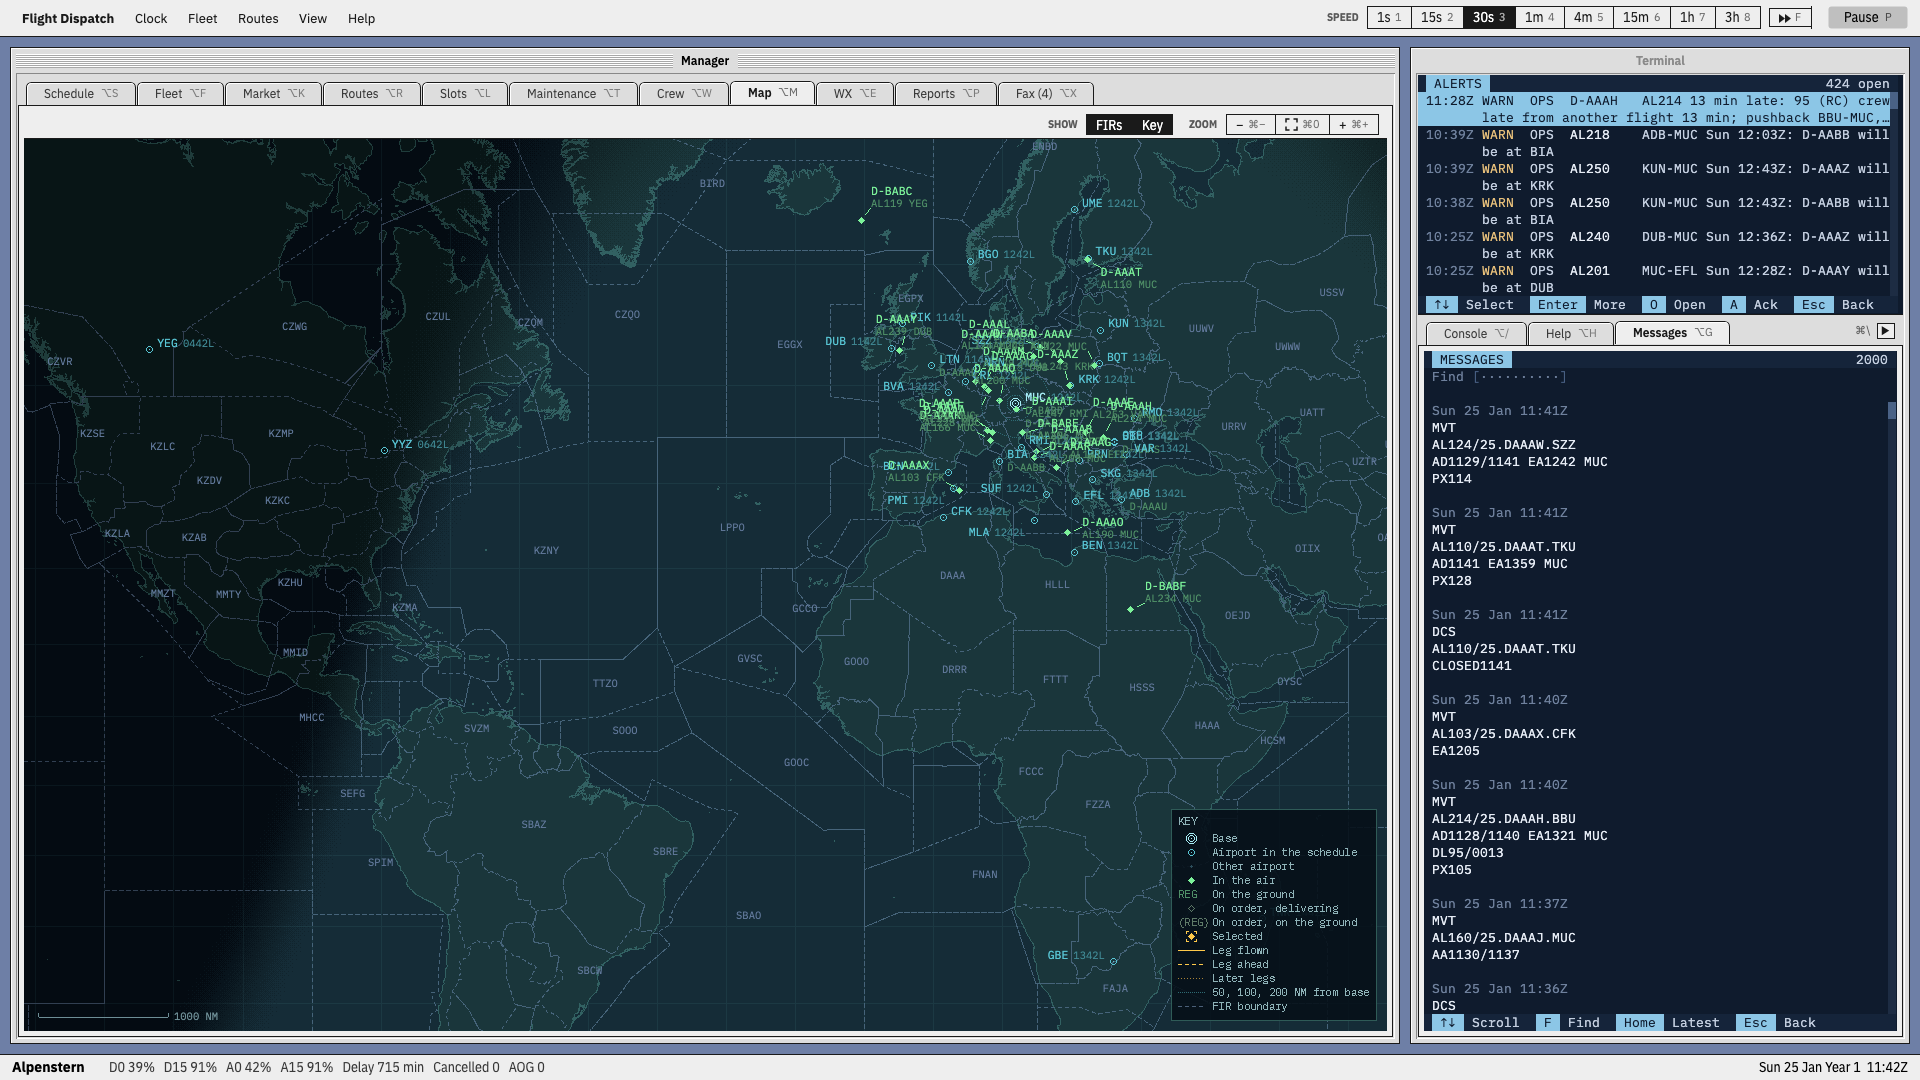
A radar-style world map of the network: the airports served with their local times, and every aircraft in the air with its flight and destination, under the day and night line.
Weather
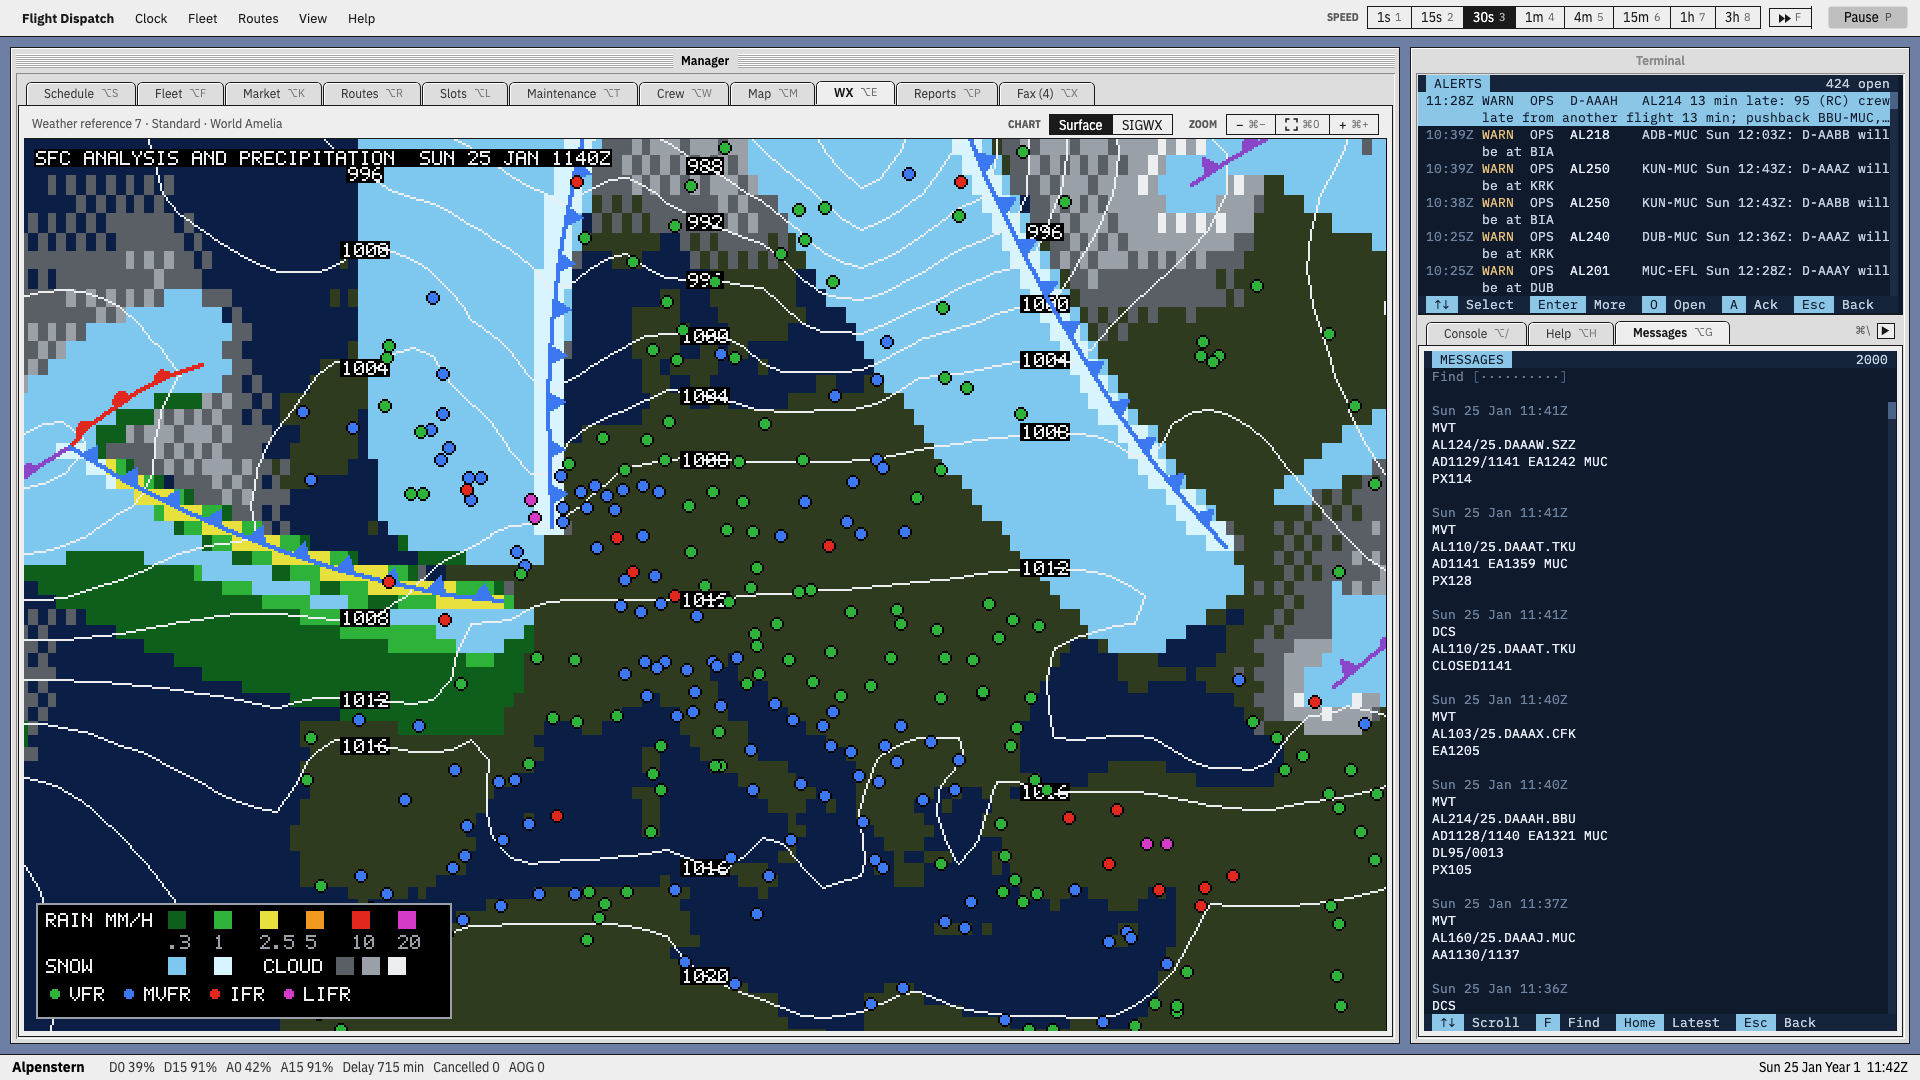
The surface analysis: isobars with pressure in hPa, warm, cold and occluded fronts, rain and snow by rate, cloud, and every airport coloured by its flight category (VFR, MVFR, IFR, LIFR) from its latest METAR. It pans and zooms, and moves on as the weather does.
SIGWX Chart
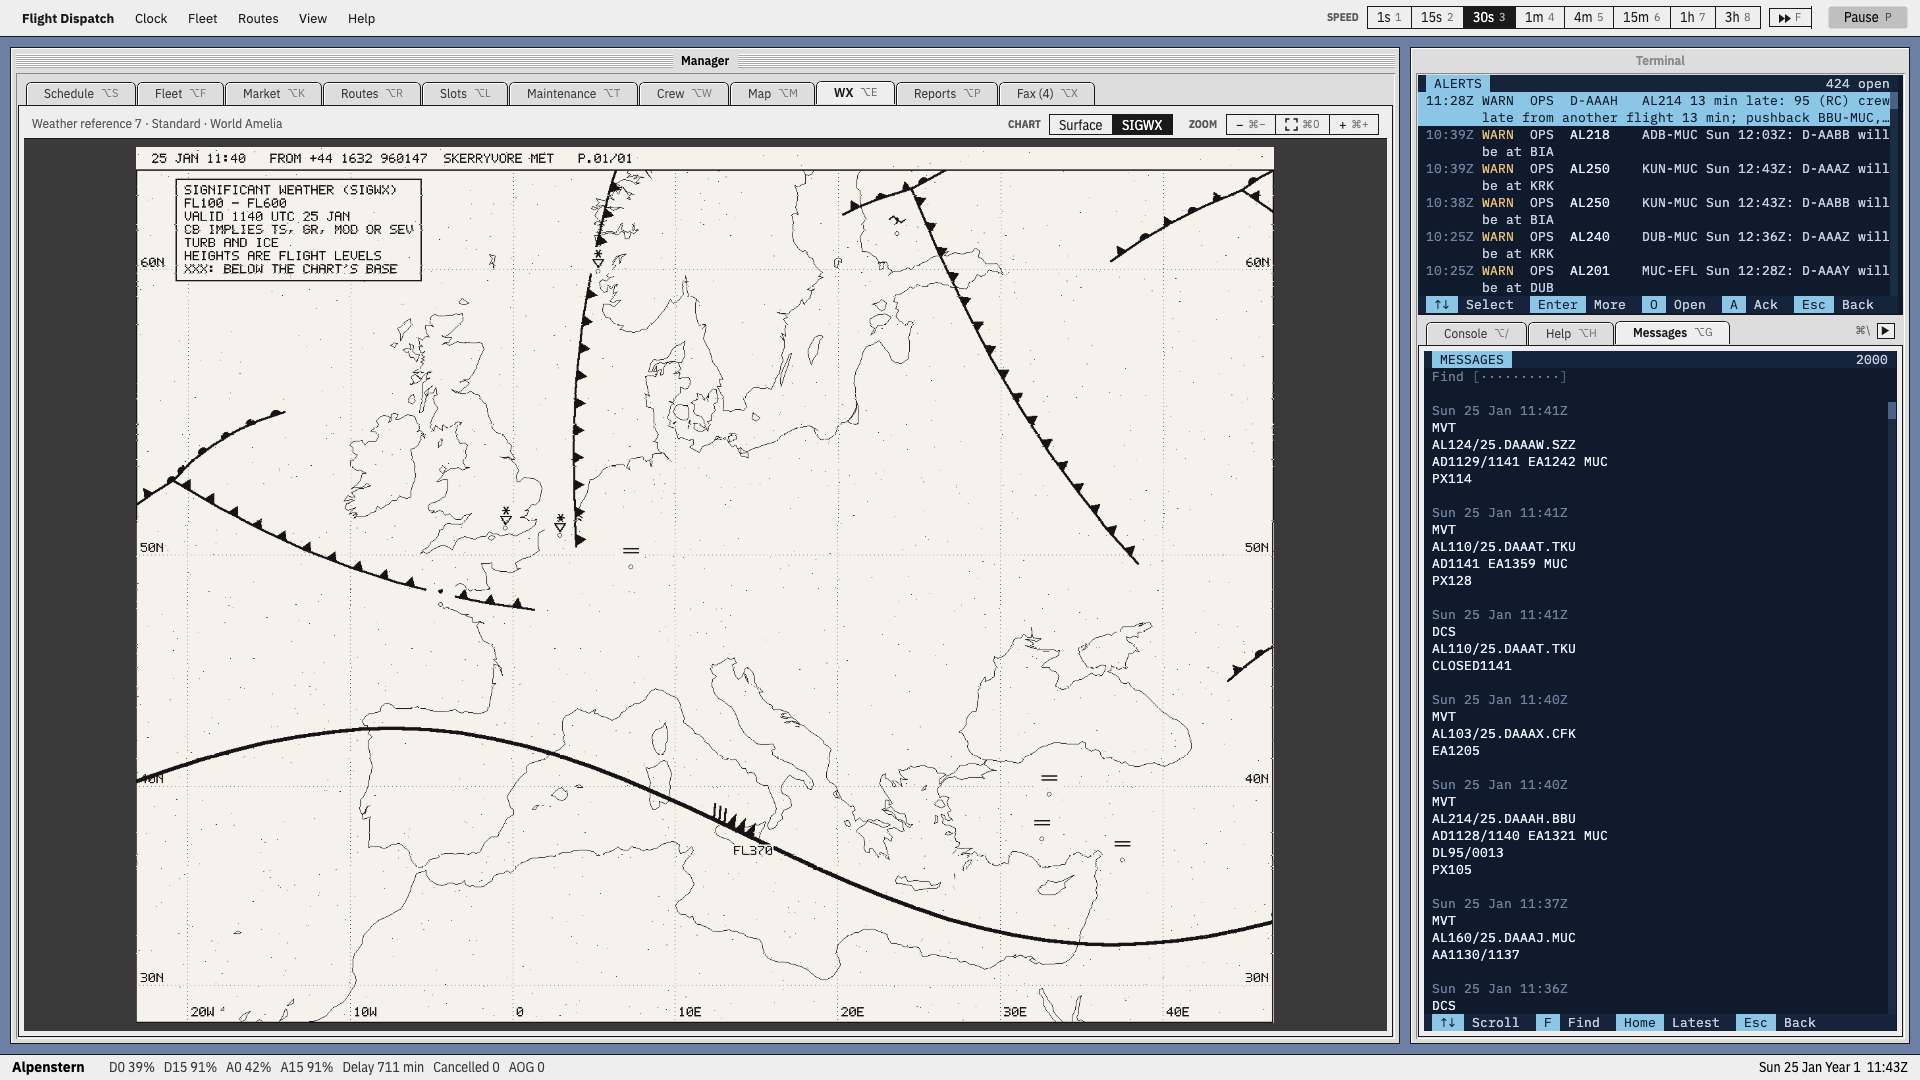
The significant weather chart from FL100 to FL600, as it arrives by fax from the met office: fronts, the jet stream with its flight level, and the standard symbols for significant weather, in black and white as a received chart is.
Reports
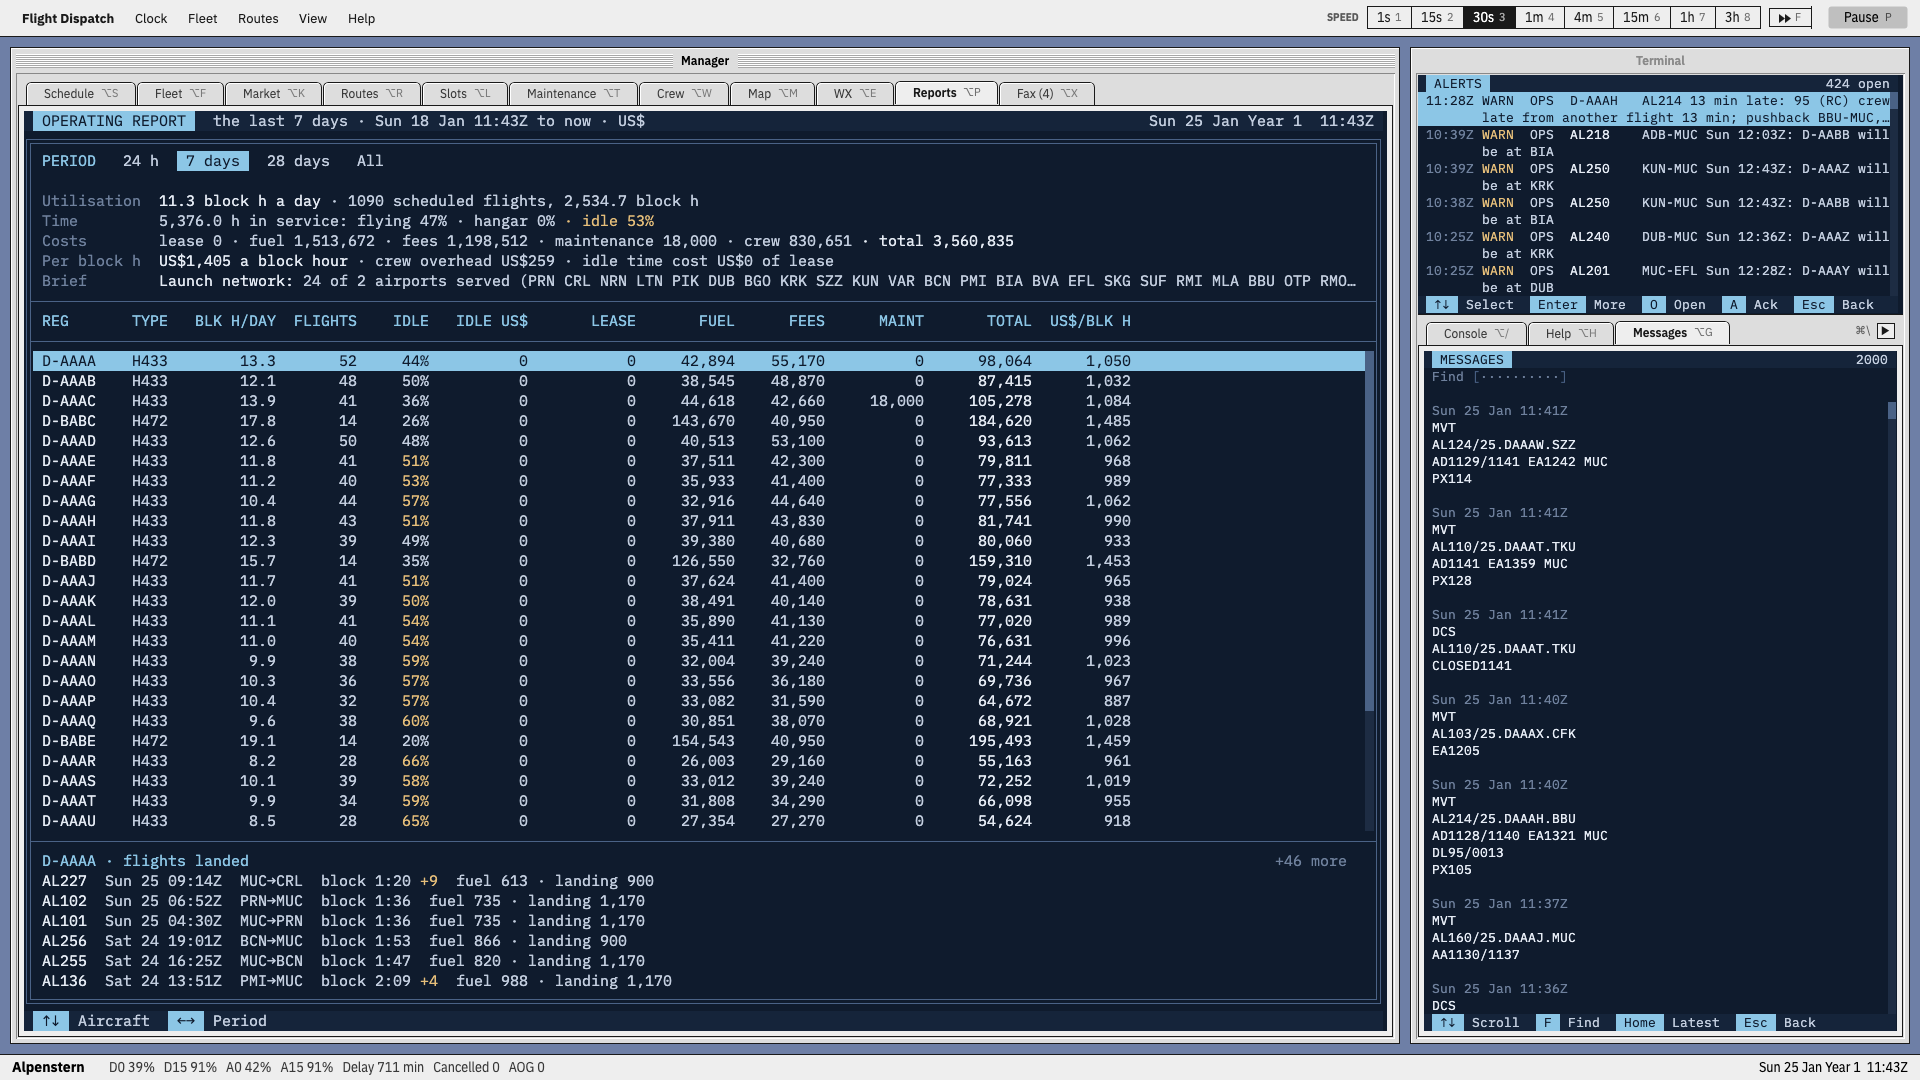
The operation’s figures over 24 hours, 7 days, 28 days or all time: utilisation, time flying and idle, and costs (lease, fuel, fees, maintenance, crew) per aircraft and per block hour. The selected aircraft lists the flights it landed, with block times, delays, fuel and landing fees.
Fax
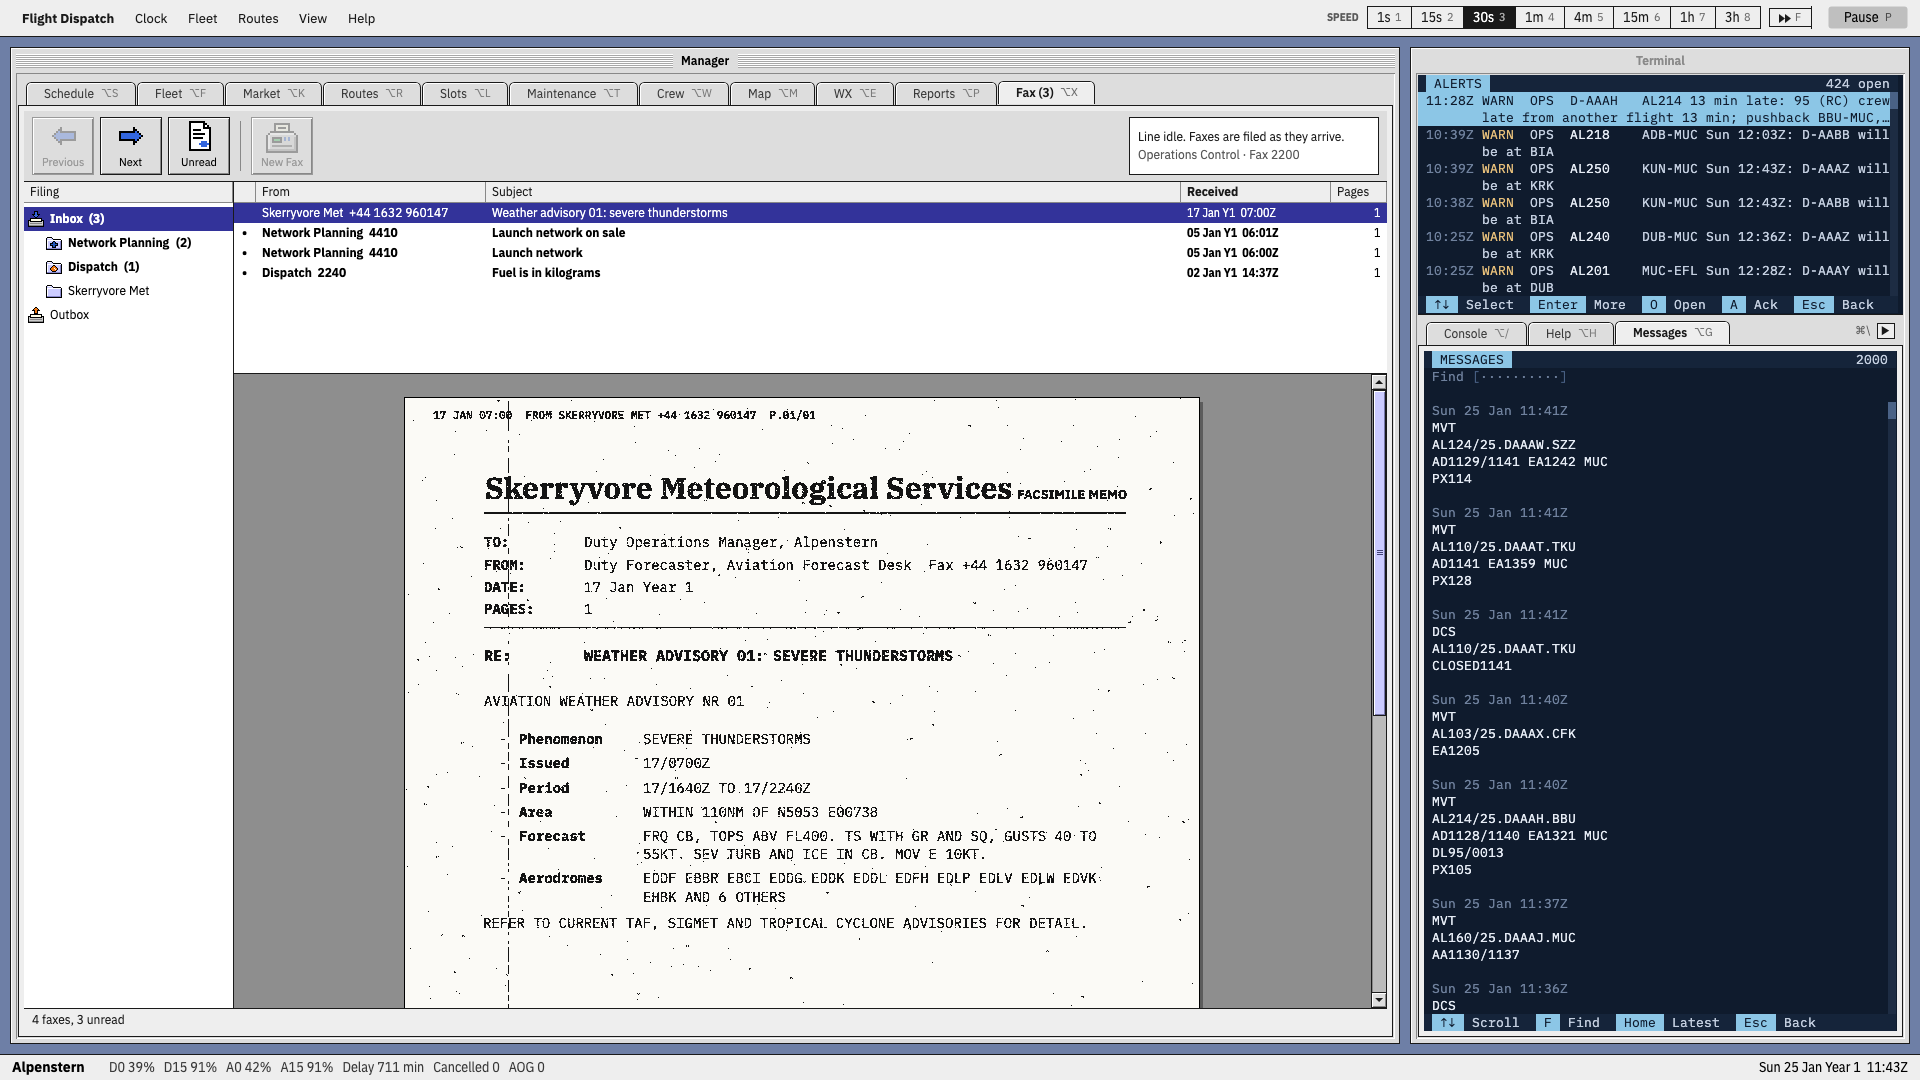
The operations room’s fax machine: faxes from the airline’s own departments and from outside, such as the met office, filed by sender, each shown as the received page. Here, a weather advisory warning of severe thunderstorms, with its period, area, forecast and the aerodromes affected.